Definition
The RSI, Relative Strength Index, was created by J. Welles Wilder In 1978, published in the book New Concepts in Technical Trading Systems, and is defined as a momentum oscillator and measures the speed and magnitude of price changes of one active oscillators.
Moment oscillators operate in a fixed band, with their values varying between two limits, and calculate the difference between the current price and a price at a certain point in the past. The basic function of this indicator is to tell when the asset is overbought or oversold, which is when an asset is being traded at a price above or below its "real" value.
Calculations and Parameters
To calculate the value of the RSI it is necessary to determine the so-called relative force factor:
RS = (average gains in a set period / average losses in a set period)
Basically, RS is a relationship between the average of gains and losses within the time period chosen. The time period most commonly used in the RSI calculation is equal to 14. To keep the value of RS contained between 0 and 100, the RSI is then calculated as:

Graphic representation

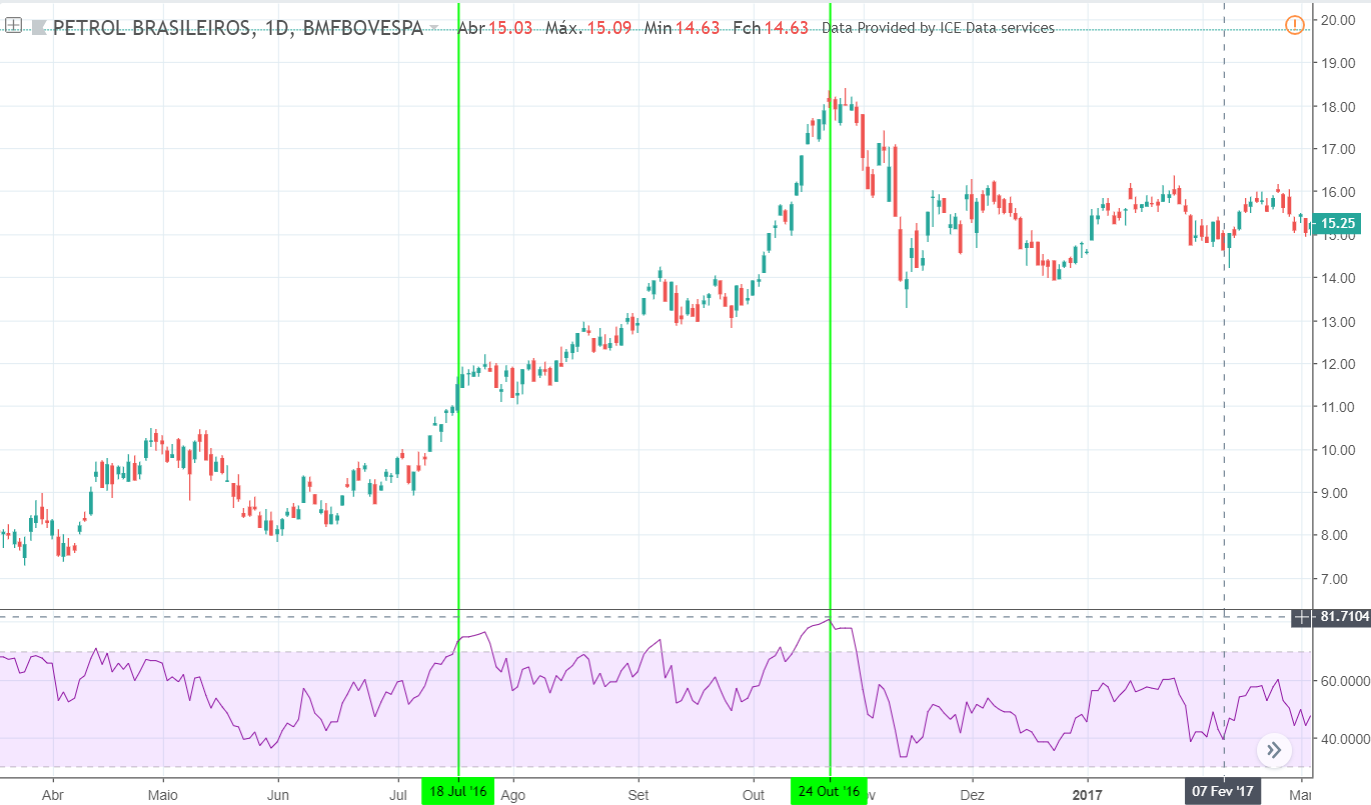
The value of the RSI varies between 0-100 , and drawn in the image above are the standard 30-70 markings.
Using RSI
Trend reversal due to overbought / oversold
As stated at the beginning of this article, the basic function of this indicator is to tell you when the asset is overbought (RSI above 70) or oversold (RSI below 30), which may be a sign of a reversal of the asset's current trend. Some traders set lower overbought and oversold values (20-80, or up to 10-90) to reduce the number of false signals. It should be noted that sudden price changes have a large influence on the value of the RSI, and the occurrence of these sudden changes is what would be indicative of a price reversal coming. However, these abrupt changes may be a false indicator of reversal, so it is always recommended that the RSI be used with some other indicator(s) to confirm a possible reversal, as shown in first situation in the figure above.
Divergence RSI / Price
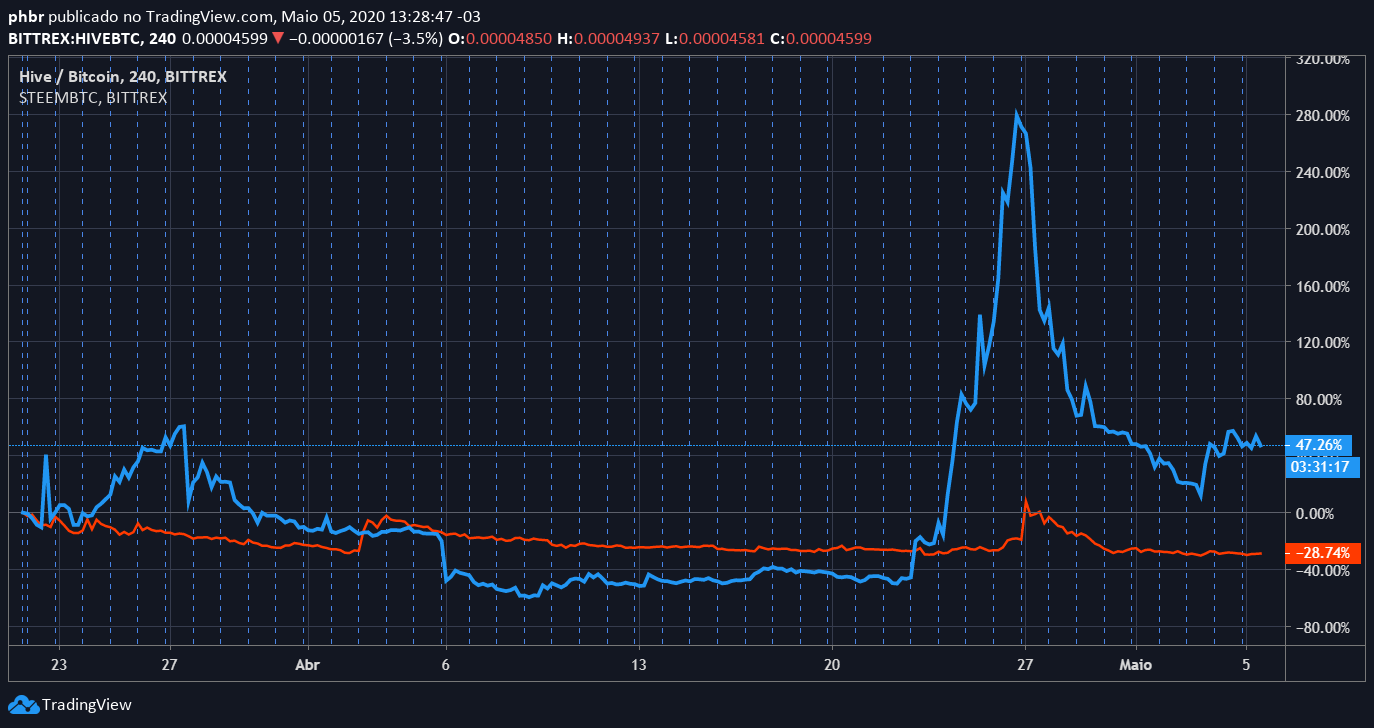
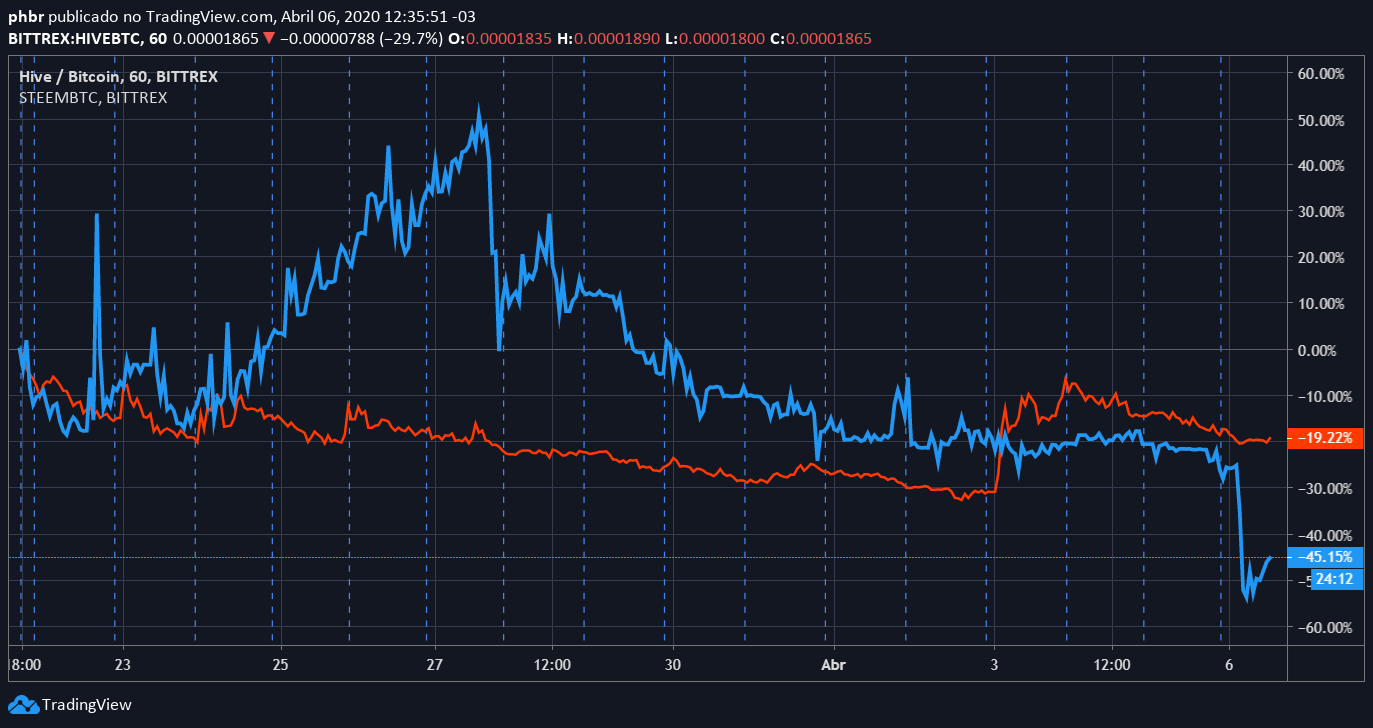
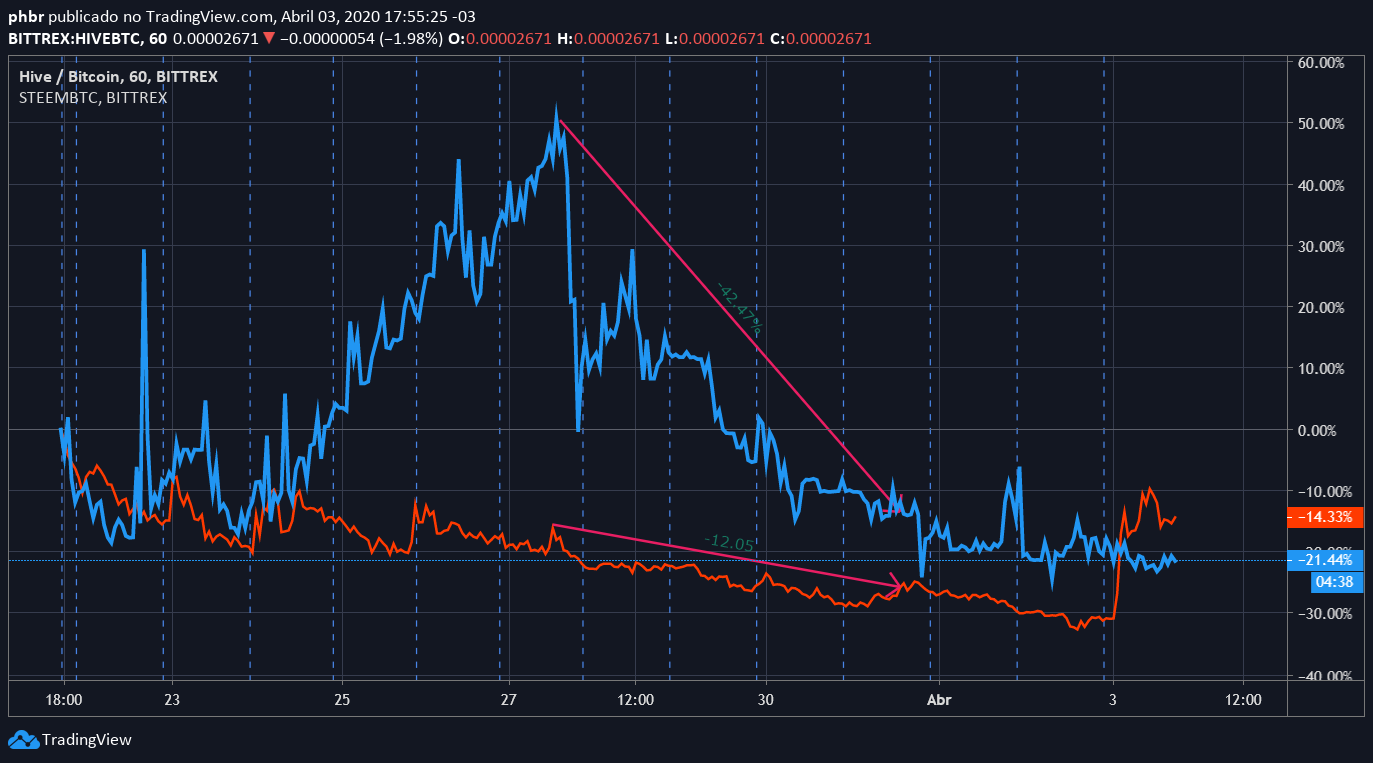
Another way to use RSI (and improve its use) is by looking at the divergence between the asset price and the RSI value. Divergence occurs when the price reaches a new high / low, but the RSI does not.

**Strategies Using IHR **
- RSI Divergence
- RSI + CCI
- RSIOMA + CCI + EMA
- RSI + Mean Crossing
- RSI + Engolfo Candle
Want to follow my journey in the world of trade? Visit Trading passo a passo
Links worth a click
CoinTracking - Cryptos Portfolio Manager
Mannabase - Basic Income Token
freebitco.io - Best faucet I've found so far
Earn.com - Get Bitcoins to answer emails
Aelf - Earn Aelf tokens (ELF) doing daily tasks