Definition
The moving average is probably the most widely used indicator in financial markets.
Its main use is as a trend indicator, and although is generally used in conjunction with price, it can also be used to indicate a trend of volume, or even to be applied over some other indicator.
As the name says, the indicator value is an average of the specified value in a given number of periods. With each new period, a new mean value is calculated using the data of the specified number of periods.
It is moving precisely because at each closing of a period, a new point in the line is drawn, and the value prior to the amount of the given period is excluded from the calculation
For example, if the chart displays 10 price candles, and the 10-period Moving Average is being calculated, the result will be the average value of those 10 candles. When the formation of the 11th candle begins, the value of the 1st candle is discarded, and the mean is calculated with the candles values from number 2 to 11.
Graphic representation
In general, the moving average is shown in the chart in the form of a line, which is drawn as time progresses.
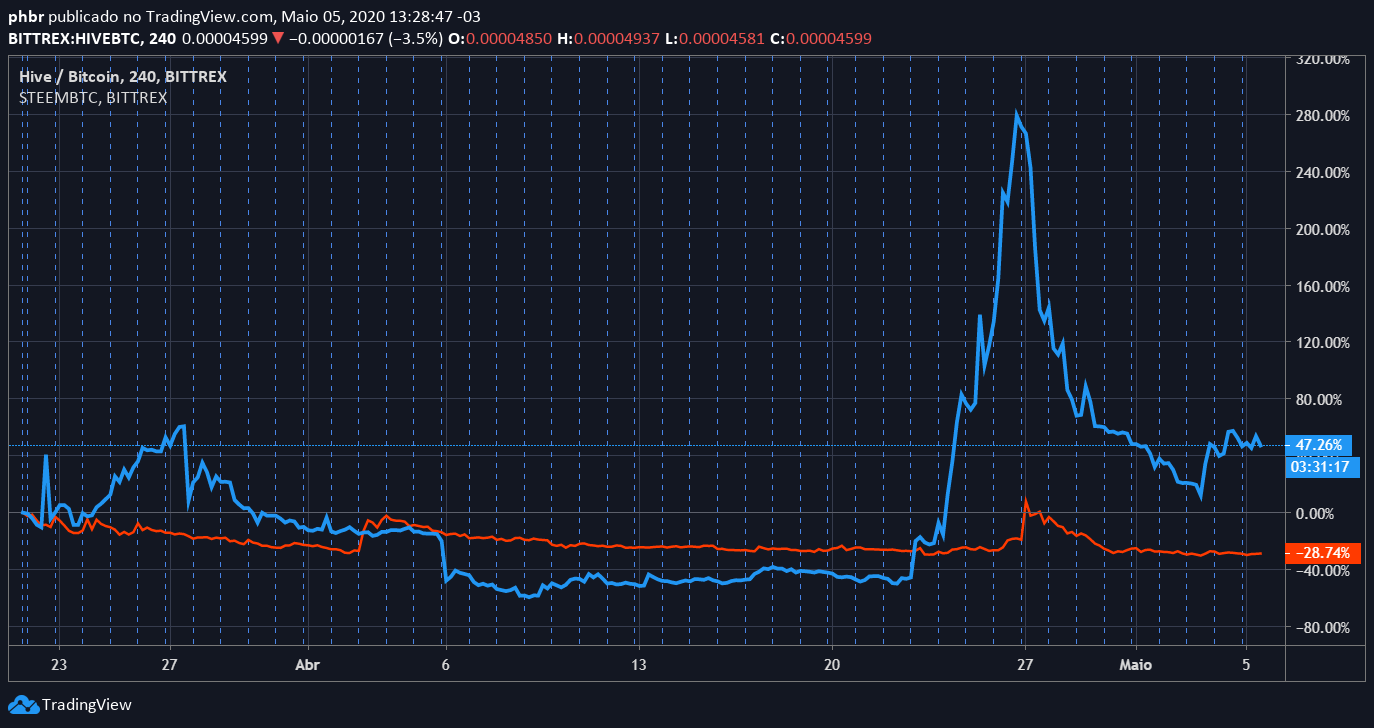
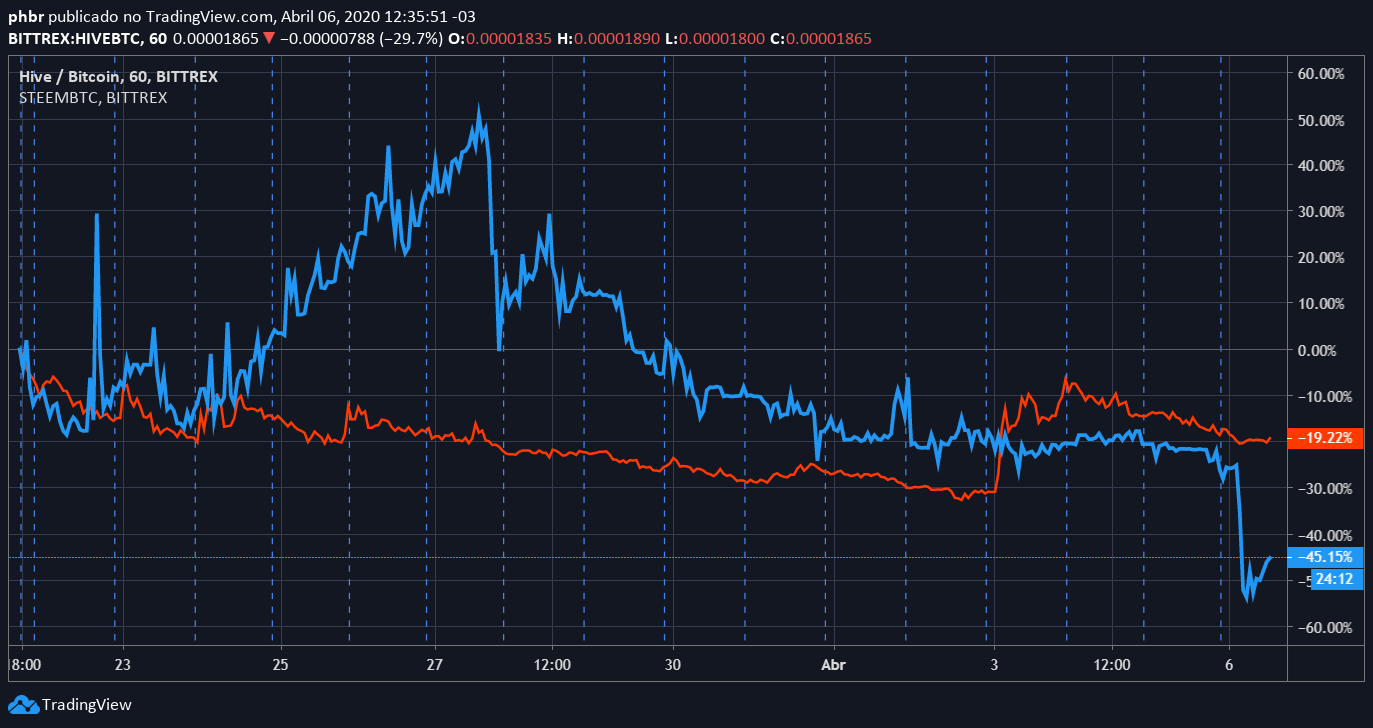
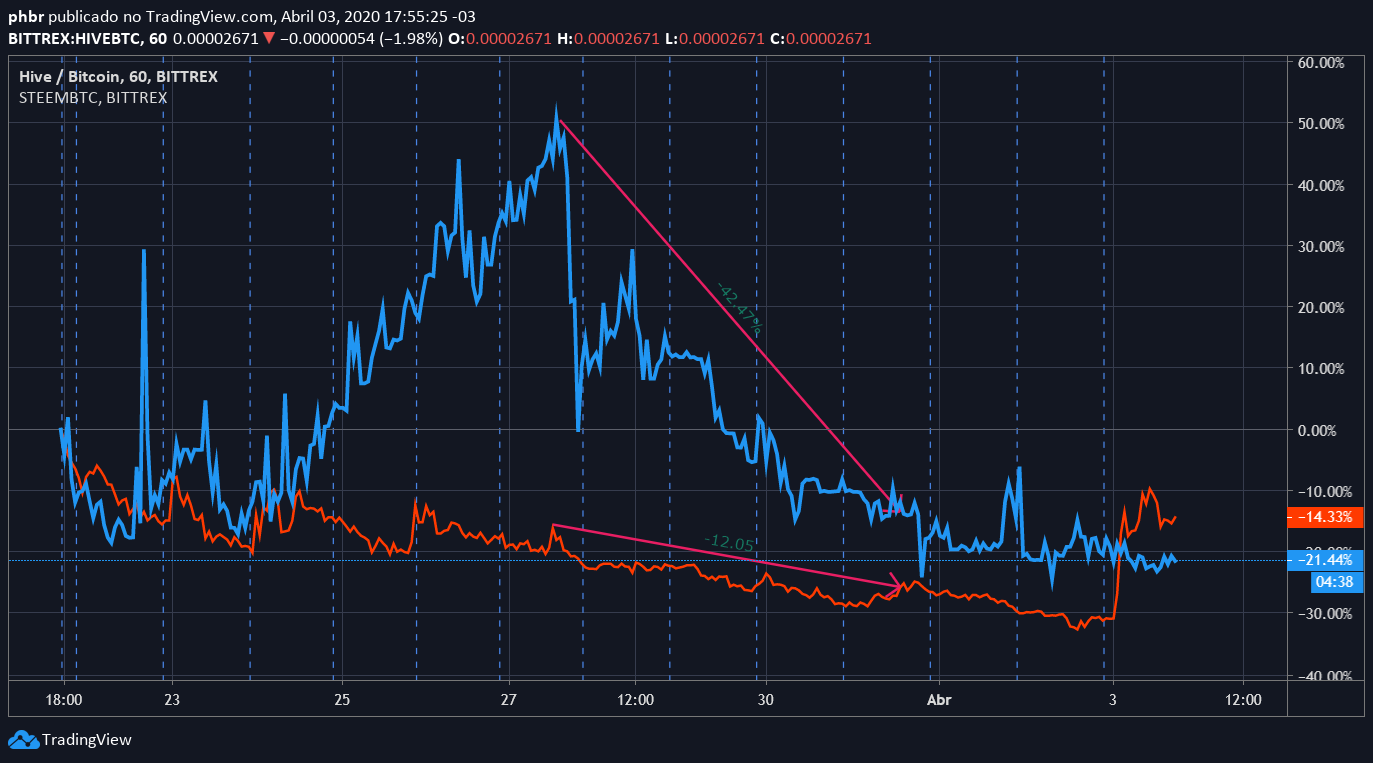
In the figure below, a Simple Moving Average of 200 is plotted on the one-hour period chart.

Calculations and Parameters
The use of the moving average requires the specification of some parameters:
1 - What type of average will be calculated
There are 4 types of moving average that can be calculated
1.1 Simple Moving Average (SMA)
The simple moving average (or arithmetic average) is calculated by the sum of the set of values, divided by the sum of elements added.

V=value calculated
n = number of periods
The previous image is the representation of a Simple Moving Average.
1.2 Exponential Moving Average (EMA)
The Exponential Moving Average gives a bigger weight to the most recent value to be used in the calculation of the mean.

V=Value
EMAant = EMA value of the previous period,
n = number of periods
In the drawing below, the red line is an SMA and Blue is an EMA. It can be seen that the EMA responds more quickly to the price change.

1.3 Smoothed Moving Average (SMMA)
Smoothed Moving Average assigns the same weight to both the most recent and the oldest value. Unlike the Simple Moving Average, no value is discarded in the calculation. The calculation of the Smoothed Moving Average takes into account the entire value history, resulting in an average that eliminates short-term fluctuations.
The calculation of SMMA occurs in some steps:
- First the simple moving average value is calculated

- The value of the Smoothed Moving Average is then calculated

Being,
SMMA1 = The smoothed moving average of the first period
SMMAi = The smoothed moving average of the current period (minus the first)
Vi = Value of the current period
n = the calculation period parameter
Below, in green, the Smoothed Mobile Average is drawn.

1.4 - Linear Wheighted Moving Average (LWMA)
The Linear Weighted Moving Average, as well as the Exponential Moving Average, places a greater weight in the most recent value of the calculation, but are calculated in a different way.
As the name says, this is a weighted average, adding a greater weight to the most recent period.
For example, in a 10-period LWMA, the most recent period will have the weight 10, the previous weight 9, and so on.
The calculation takes place as follows:

V = Period value
n = number of periods
This average is no longer used by investors due to the creation of the Exponential Moving Average, but it can still be useful in some operations.
Below, in yellow, the Weighted Moving Average is drawn.

Use of Moving Averages
The most common way of using moving averages as an indicator is by applying them to price.
The information that the moving averages pass is a smoothing of the market price, reducing the noise that occurs due to the volatility of the assets. Therefore, moving averages are a good trend indicator.
In the figures above, where we plotted the moving averages on the chart with a calculation period of 200, it can be clearly seen that the averages follow the main direction of the price.
When the price cross with the average is indicative of a possible reversal of the trend.
It is important to note that the period chosen for the calculation will define the term of the trend. A moving average value of 200 will reflect a long-term trend, while a moving average of 24 will reflect a short-term trend.
Another very common use by analysts is the use of the average lines as supports and resistance, which can be used to determine points of entry and exit of an operation.
Strategies using moving averages
Due to the lag between the moving average and the price, the strategies that use them usually are trend strategies, where buying and selling accompanies the direction of the trend.
Some of these strategies are:
- Crossing averages
- Support / Resistance to choose entry points for patches
- Price crossing with averages